![]() If you wish to analyse longitudinal data sometimes it is helpful to plot each experimental subject’s data at each timepoint to get a feel for the patterns or trends. You can often learn more from this raw data than a boxplot or line graph of the means. I am a habitual SPSS user but have found myself limited with it’s capabilities. In this short article, aimed at SPSS users who are new to R, I will show you how to produce a ‘Spaghetti Plot’ using R.
If you wish to analyse longitudinal data sometimes it is helpful to plot each experimental subject’s data at each timepoint to get a feel for the patterns or trends. You can often learn more from this raw data than a boxplot or line graph of the means. I am a habitual SPSS user but have found myself limited with it’s capabilities. In this short article, aimed at SPSS users who are new to R, I will show you how to produce a ‘Spaghetti Plot’ using R.
For this example I have measurements of 50 patient’s serum rhubarb concentrations after ingestion of a large rhubarb based meal. Data is recorded at several time-points: 0,3,6 and then every 6 months. Many of the patients do not have observations at each timepoint. The current data Format in SPSS is
| ID | Time | Rhubarb |
| 1 | 0 | 32.3 |
| 1 | 3 | 32.3 |
| 1 | 6 | 12.1 |
| 1 | 12 | 123 |
| 2 | 0 | 12.2 |
| 2 | 3 | 32.6 |
| .. | .. | .. |
| 50 | 12 | 34 |
However to plot this in SPSS you need turn the data into long format using
Menu>>Data>>Restructure>>Case to Variables
to give you this format:-
| Month | Rhubarb1 | Rhubarb2 | Rhubarb3 | Rhubarb4 |
| 0 | 12.7 | 32.3 | 32.3 | 32.3 |
| 3 | 34.1 | 32.3 | 32.3 | 32.3 |
| .. | .. | .. | .. | .. |
| 12 | 12.1 | 123 | 32.3 | 34 |
When you have your data in this format you can use
Menu>>Graphs>>Line Charts>>Multiple>> "Values of individual Cases"
Then place Time as the Category label and “Lines Represent” as “Rhubarb1, Rhubarb2, etc”. This will give you the following graph. (I have only plotted a few cases for simplicity)
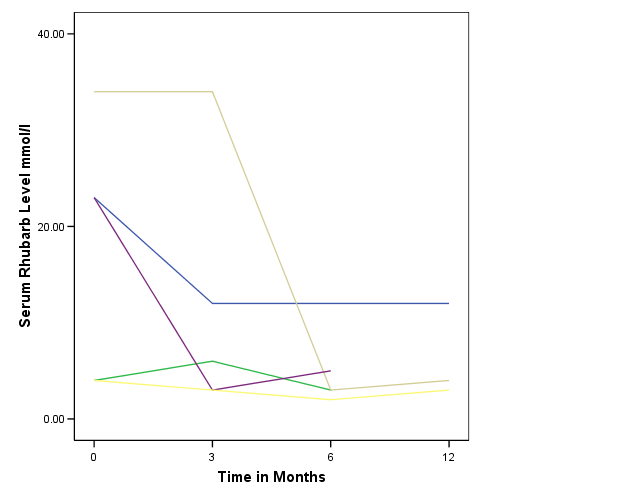
The major flaw with this graph is that the x-scale is ordinal rather than being a continuous scale..really I would like to see the distance between month 0 and 3 half the distance between 6 and 12. The only possible solution in SPSS is to plot the data as a multiple overlay scatter plot with interpolation lines. This works for a few subjects but is tedious for more than a couple and I have found impossible for 50.
My solution is to use R (R-Project for Statistical Computing). R is an open-source programming environment that is well suited to statistics and graphical applications. You can visit the R website here. (To produce this graph you do not need to learn R, you can do it by cutting and pasting.)
Once you have downloaded R you need to save your SPSS file in a tab delimited format (.DAT). Do this using the Save as dialog in SPSS. A library is available to import SPSS files directly, but that is beyond the scope of this article.
Luckily R can cope with your data in Long or univariate format.
The code to produce the graph is below, you will need to edit the input path of the input and export files, and also change the field names from ID, Time, Rhubarb etc. Then just cut and paste into R and press return to generate the PDF
#Open Lattice Library

library(lattice)

#Load tab delimited file with headers for Field names

data1 <-read.table("D:/Documents and Settings/Nerd/Desktop/Rhubarb.dat",header = TRUE ,sep = "\t")

#Set output to PDF and set output path and filename

pdf("D:/Documents and Settings/Nerd/Desktop/Output.pdf",width=8)

#Plot data by Month

xyplot(Rhubarb ~ Time, groups = ID,

data = data1,

type = "l" ,xlab="Months from Study Start",ylab="Plasma Rhubarb mg/dl",

scales =list(x=list(at=c(0,3,6,12))))

dev.off()

#Close the PDF
You can specify the x-axis labels that are displayed by changing the list (0,3,6,12) , or let them be generated automatically by R by removing
scales =list(x=list(at=c(0,3,6,12)))
The output file in png format is shown below.
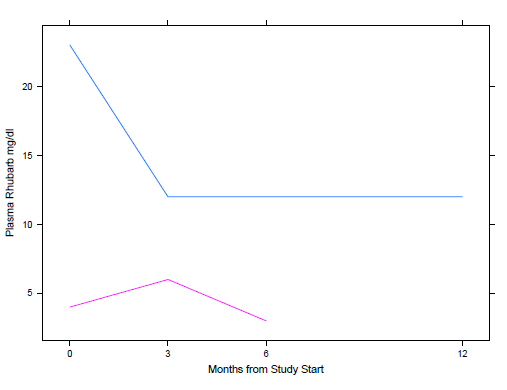
The real beauty of this technique is how easily you can increase the number of subjects in your graph by cutting and pasting more data and simply re-running the same script. A more complicated example (The example I was originally working on) is shown below:-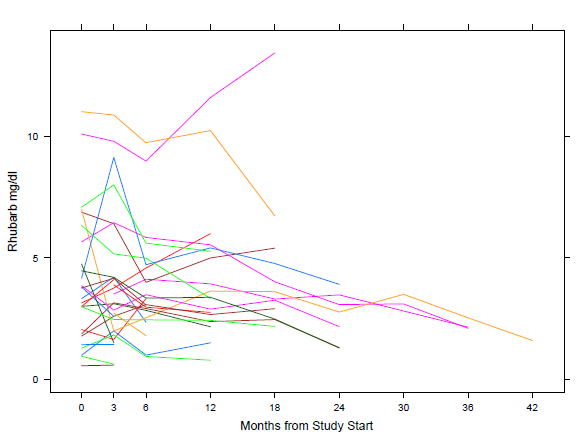
11 responses so far ↓
1 Thomas // Nov 9, 2007 at 11:50 pm
Nice one!
R, being entirely command line driven, has a very steep learning curve. But I have found out learning R will be much easier by using the manuals for S+, which is (rather crudely) the father of R:
http://www.insightful.com/support/doc_splus_win.asp
Useful ones are Guide to Statistics Vol I and II, and Guide to Graphics. Just be aware that a minority of S+ commands have completely different names in R.
Thomas
COI: Hate Microsoft, but have to use Windows. Support open source softwares.
2 Andrew // Nov 28, 2007 at 3:35 pm
I’d be interested to know what you think the most useful resources to learn how to use R. I find that most of the online resources leave me confused (I suspect they assume a background in statistics).
3 James // Nov 28, 2007 at 3:38 pm
It depends on your background and what you wish to accomplish with R. In particular previous experience with other Stats programs or programming languages as well as the type of analysis you want to achieve.
Let us know and maybe we can give you some pointers.
Regards
James
4 Andrew // Nov 29, 2007 at 2:19 pm
I can use Stata- a very different language to R. I have all the stats training that an undergraduate medical degree gives, plus what I’ve picked up from the postgraduate studies I’m doing now. To clarify, I think that it is the language used in R documentation (eg “vector”) that is confusing.
5 James // Nov 29, 2007 at 4:58 pm
Andrew,
Have a look at Quick-R which is intended for users who can use SAS,SPSS or STATA.
Regards
James
6 Ben // Dec 24, 2007 at 12:40 pm
Try this one for real beginners :
http://cran.r-project.org/doc/contrib/Verzani-SimpleR.pdf
probably the best one for learning. It is a steep learning curve. But worth it.
7 José Ãngel // Mar 13, 2008 at 9:06 am
For all the people who want to avoid learn and write all that commands, R has a nice SPSS-like GUI, u just have to load and active the Rcmdr package. Try it.
8 safwan // Oct 20, 2008 at 11:59 am
i want to know how to writ full program to solve linear regression equation
and also i like to know how run the R program
9 Mark // Jul 12, 2009 at 12:41 pm
I can’t fault Dr. Dalgaard’s introductory text on R. From there, it depends on which tests and the type of data you are analysing.
10 bob // Sep 19, 2009 at 1:20 am
Also take a look at Rattle which is a gui frontend to R with data mining capabilities
11 robin // Jun 4, 2014 at 11:43 am
R Commander followed by Deducer are the best gui front ends but for longitudinal data you do usually need to use R code – please prove me wrong! This is because you usually need to convert the dataset from what is known as wide format to long format one solution might be to do that in SPSS first.
Leave a Comment
(Don't forget to fill in the Captcha)